चित्र:Covid-19 new cases in top 5 countries and the world.png
Jump to navigation
Jump to search


ए नमूना के साइज: ८०० × ५५३ पिक्सेल. अउरी रिजोल्यूशन: ३२० × २२१ पिक्सेल | ६४० × ४४२ पिक्सेल | ८४१ × ५८१ पिक्सेल.
ओरिजनल फाइल (८४१ × ५८१ पिक्सेल, फाइल साइज: १२९ KB, MIME टाइप: image/png)

|
This graph image could be re-created using vector graphics as an SVG file. This has several advantages; see Commons:Media for cleanup for more information. If an SVG form of this image is available, please upload it and afterwards replace this template with
{{vector version available|new image name}}.
It is recommended to name the SVG file “Covid-19 new cases in top 5 countries and the world.svg”—then the template Vector version available (or Vva) does not need the new image name parameter. |
सारांश
| बिबरण |
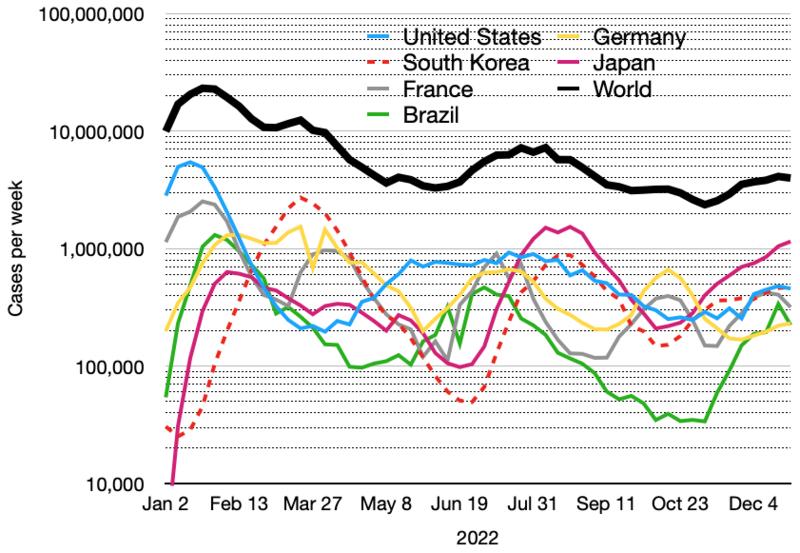
English: This data is now sourced from the Our World in Data, which comes in turn from the John Hopkins Covid-19 Data Repository. This is presented as the weekly total rather than a 7 day rolling average. This is now a weekly total rather than a 7 day rolling average. The top 6 countries are chosen by the geometric average of new cases and deaths over the preceding month in order to keep this relevant. Also the graph is limited to approximately the last year. |
| तारीख | |
| स्रोत | आपन रचना |
| लेखक | Chris55 |
लाइसेंसिंग
I, the copyright holder of this work, hereby publish it under the following license:
This file is licensed under the Creative Commons Attribution-Share Alike 4.0 International license.
- आप फ्री बानी:
- साझा करे खातिर – रचना के नकल करे, बाँटे आ दुसरी जगह भेजे खातिर
- रीमिक्स करे खातिर – काम के अपनी हिसाब से बनावे खातिर
- नीचे दिहल कारणन की तहत:
- एट्रीब्यूशन – लाइसेंस के कड़ी दे के उचित श्रेय (क्रेडिट) दिहल जरूरी बा आ अगर कौनों बदलाव कइल गइल बा तब ओहू के बतावल जाए के चाहीं। आप ई काम कौनों उचित तरीका से क सकत बानी, बाकी ई न झलके के चाहीं की जेकरा लगे लाइसेंस बा ऊ राउर चाहे राउर काम के समर्थन करत बाटे या सही बतावत बा।
- शेयर अलाइक (share alike) – अगर आप एह सामग्री के आधार बना के कुछ रिमिक्स करत बानी, रूप बदलाव करत बानी, चाहे कुछ जोड़ के सामग्री के बढ़ावत बानी, आपके आपन योगदान ठीक एही या कंपेटिबल लाइसेंस जइसन कि ओरिजनल बाटे, के तहत होखे के चाहीं।
फाइल के इतिहास
ओ समय ई फाइल कइसन लउके ई देखे खातिर कौनों तारीख/समय पर क्लिक करीं।
| तारीख/समय | चिप्पी रूप | डाइमेंशन | प्रयोगकर्ता | टिप्पणी | |
|---|---|---|---|---|---|
| वर्तमान | १८:५९, ३१ दिसंबर २०२२ | | ८४१ × ५८१ (१२९ KB) | wikimediacommons>Chris55 | update to Dec 25 - 2022 only. France replaces Taiwan |
फाइल के उपयोग
फाइल के इस्तेमाल पन्ना करत बा: