चित्र:2010ElectoralCartogramGott.png

ए नमूना के साइज: २२० × १४२ पिक्सेल. अउरी रिजोल्यूशन: ३२० × २०६ पिक्सेल | ९०० × ५८० पिक्सेल.
ओरिजनल फाइल (९०० × ५८० पिक्सेल, फाइल साइज: ४० KB, MIME टाइप: image/png)


|
This election map image could be re-created using vector graphics as a SVG file. This has several advantages; see Commons:Media for cleanup for more information. If a SVG form of this image is available, please upload it and afterwards replace this template with
{{vector version available|new image name}}.It is recommended to name the SVG file “2010ElectoralCartogramGott.svg”—then the template Vector version available (or Vva) does not need the new image name parameter. |
सारांश
| बिबरण2010ElectoralCartogramGott.png |
English: Gott and Colley's Electoral Cartogram showing the electoral votes apportioned to each state as a result of the 2010 Census. Note that the cartogram is topologically correct in that any state that borders another state in reality borders that state on the cartogram, and wherever multiple states meet at a point in reality, they also do so on the cartogram. The color map uses a 4-color system, which because of the topological correctness, could be applied to a standard geographic map as well. A previous version of this cartogram (reflecting the 2000 apportionment) was published in Mathematical and Computer Modeling. This image, and a monochrome version will be maintained at http://www.colleyrankings.com/cartogram2010, where one may also expect to find polling and election information in 2012. |
| तारीख | |
| स्रोत | आपन रचना |
| लेखक | Wes colley |

लाइसेंसिंग
I, the copyright holder of this work, hereby publish it under the following license:


This file is licensed under the Creative Commons Attribution 3.0 Unported license.
- आप फ्री बानी:
- साझा करे खातिर – रचना के नकल करे, बाँटे आ दुसरी जगह भेजे खातिर
- रीमिक्स करे खातिर – काम के अपनी हिसाब से बनावे खातिर
- नीचे दिहल कारणन की तहत:
- एट्रीब्यूशन – लाइसेंस के कड़ी दे के उचित श्रेय (क्रेडिट) दिहल जरूरी बा आ अगर कौनों बदलाव कइल गइल बा तब ओहू के बतावल जाए के चाहीं। आप ई काम कौनों उचित तरीका से क सकत बानी, बाकी ई न झलके के चाहीं की जेकरा लगे लाइसेंस बा ऊ राउर चाहे राउर काम के समर्थन करत बाटे या सही बतावत बा।
Captions
Add a one-line explanation of what this file represents
फाइल के इतिहास
ओ समय ई फाइल कइसन लउके ई देखे खातिर कौनों तारीख/समय पर क्लिक करीं।
| तारीख/समय | चिप्पी रूप | डाइमेंशन | प्रयोगकर्ता | टिप्पणी | |
|---|---|---|---|---|---|
| वर्तमान | ००:४२, ६ जनवरी २०११ | 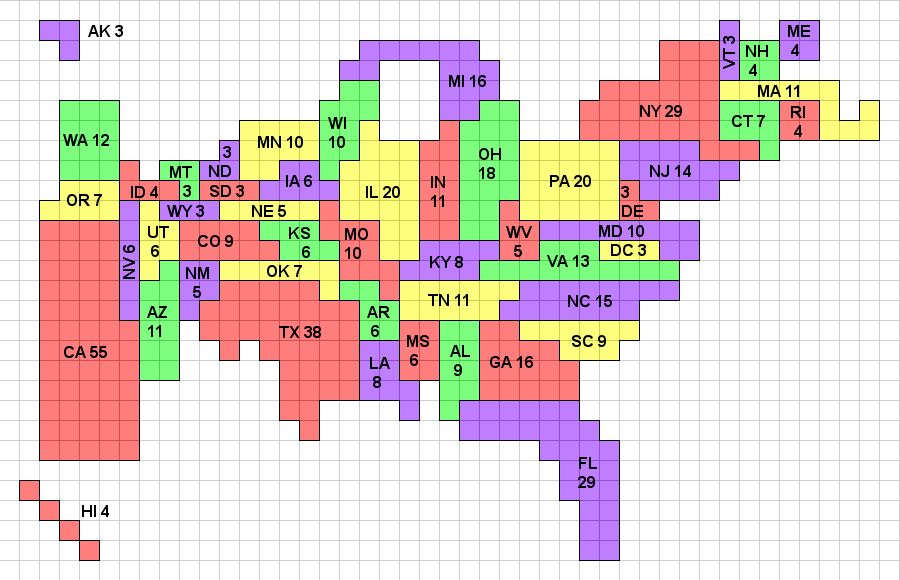 | ९०० × ५८० (४० KB) | smartcommons>Wes colley | Slight modification of annotations. |
फाइल के उपयोग
कौनों पन्ना नइखे जवन ए फाइल के इस्तेमाल करत होखे।
